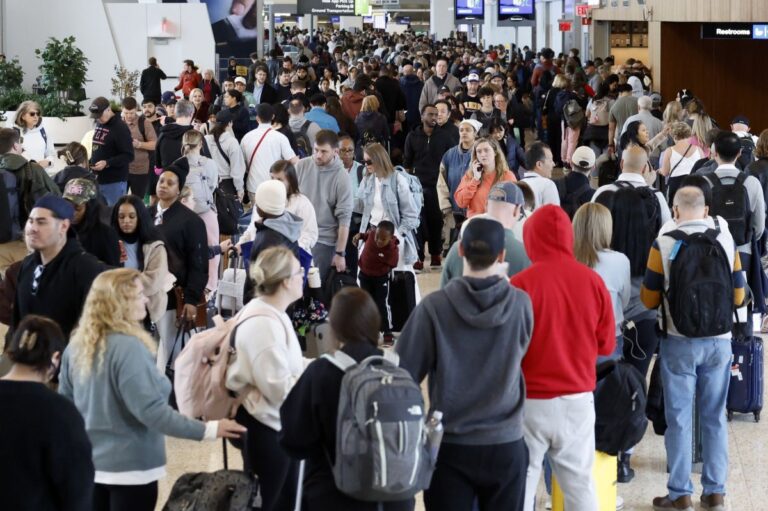
Some of the largest metropolitan areas in the United States are shrinking, and the vast majority are seeing slower growth, according to newly released government data.
The U.S. Census Bureau, which released new figures on Thursday, cited a nationwide drop in net international migration as the main factor behind the trend, a shift that coincides with President Donald Trump’s immigration crackdown.
“The nation’s largest counties like those in the New York metro area are often international migration hubs, gaining large numbers of international migrants and losing people that move to other parts of the country via domestic migration,” George Hayward, a Census Bureau demographer, said in a news release.
“With fewer gains from international migration,” he added, “these types of counties saw their population growth diminish or even turn into loss.”
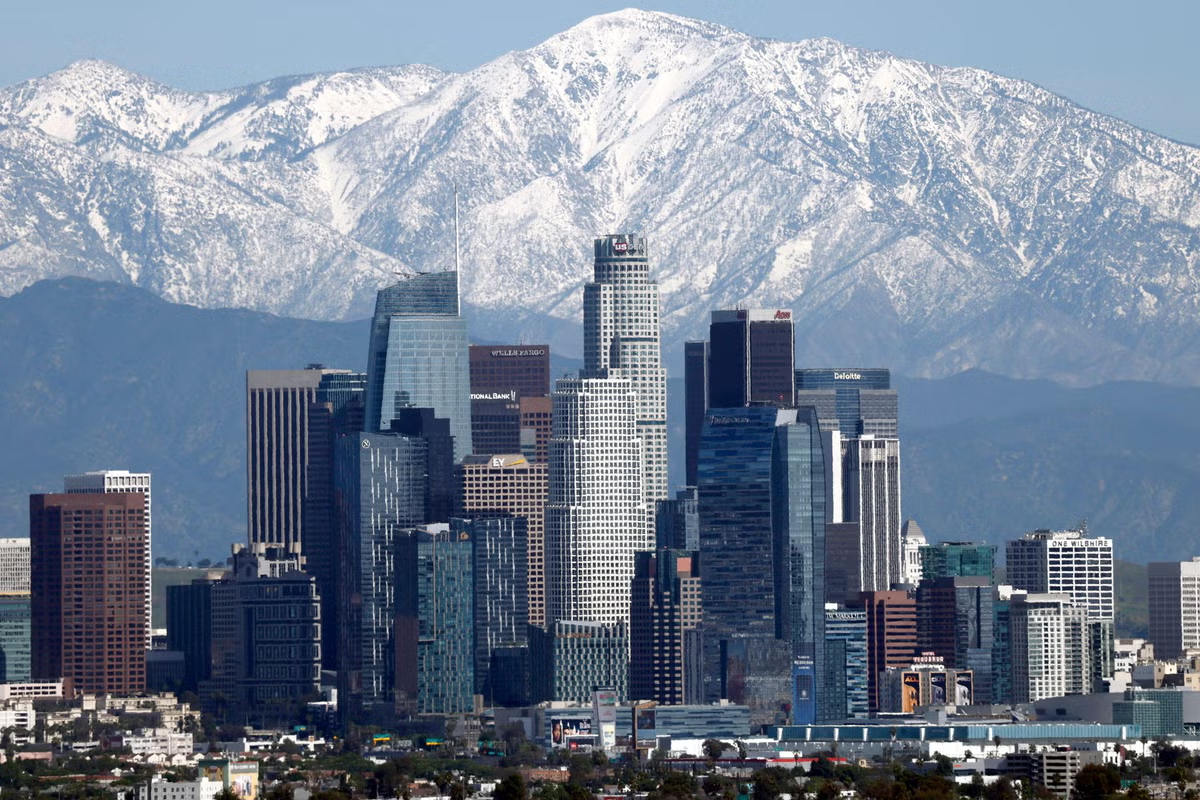
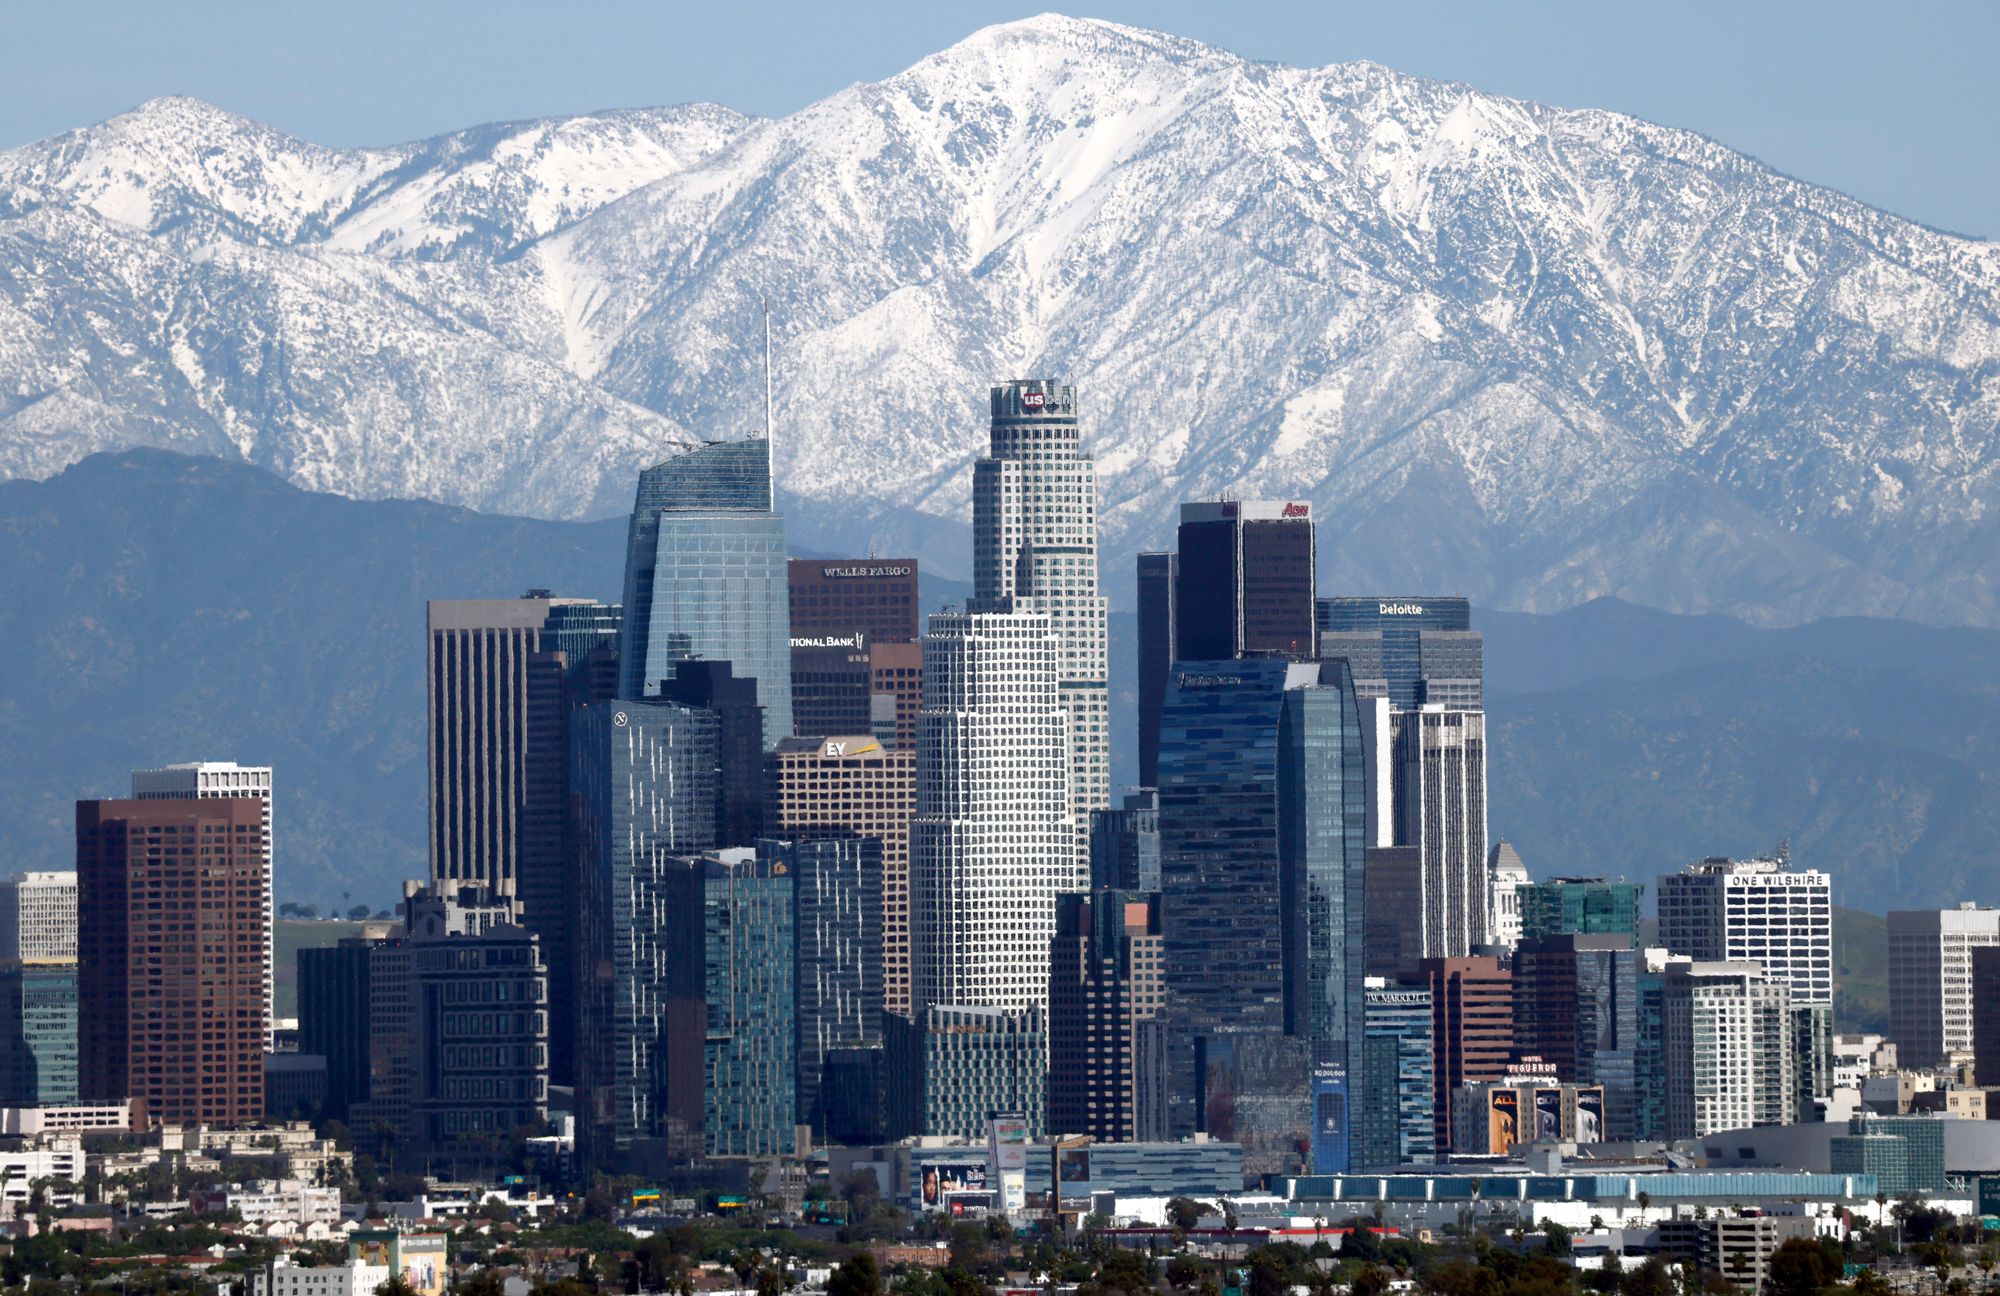
Among the areas hit hardest were Los Angeles, Miami, and San Diego, with New York City also seeing its population drop for the first time in three years. In contrast, several mid-sized and smaller metro areas saw significant growth, including Austin, Raleigh and Myrtle Beach.
The latest Census Bureau data includes year-over-year changes — between July 2024 and July 2025 — within counties and metro areas. The results were compiled using available data on births, deaths and migration flows.
Here is a breakdown of the findings.
Population growth slowed almost everywhere
Overall, population growth slowed almost everywhere, declining in most of the nation’s 3,143 counties. Among the 2,066 counties that gained residents between 2023 and 2024, nearly 80 percent saw their growth slow or reverse in 2025.
Among the small share of counties that experienced high growth rates, most were concentrated in the Southeast, particularly in Florida, Georgia, South Carolina and North Carolina.
At the same time, about 80 percent of metropolitan areas — 310 out of 387 — saw fewer people enter between 2024 and 2025 than during the previous year. Notably, the three areas with the steepest decreases are all located along the southern border: Laredo, Texas; Yuma, Arizona; and El Centro, California.
On average, the growth rate in U.S. metro areas stood at 0.6 percent, down from 1.1 percent between 2023 and 2024.
The Census Bureau, which operates under the Commerce Department, highlighted several contributing factors: domestic migration reductions and a reduced birth rate — the U.S. fertility rate stood at a near-record low 1.6 births per woman in 2024.
However, the main driver was the decline of immigrants entering the country from around the globe.
Helen You, the interim director of the Texas Demographic Center, told CBS News that the steep decreases seen along the U.S.-Mexico border highlight the impact of immigration on “year-to-year population change.”
“The vast majority of the slowdown of immigration is because of policy shifts,” Eric Finnigan, the vice president of demographics research at John Burns Research and Consulting, told The Wall Street Journal.

Trump, who promised to carry out the largest deportation program in U.S. history, began cracking down on immigration soon after taking office, beefing up interior enforcement and dramatically reducing the number of border crossings.
One year into his second term, the Department of Homeland Security claimed that close to three million illegal immigrants had left the country, including an estimated 2.2 million people who voluntarily left and over 675,000 who were deported.
Top five metro areas
Last year, population growth either slowed or reversed in each of the nation’s five largest metropolitan areas, which together are home to nearly 60 million people.
In 2025, 20,112,448 people lived in the New York City metro area, the biggest in the nation. It marked an increase of 32,361 from the previous year. By comparison, between 2023 and 2024, the population rose by 291,111.
Population growth also decelerated in the Chicago metro region, rising by 22,925 compared with 75,277 the prior year.
Two major Texas hubs saw similar slowdowns: the Dallas area added 123,557 people in 2024, down from 189,460 in the previous year, while the Houston area grew by 126,720, compared with 190,261 the year before.
By contrast, the Los Angeles metro area lost 62,454 people, after gaining 24,986 the previous year.